SafeTable logo SafeTable
Diet evidence

Any sensible diet can work.
Here is what the evidence says.

Keto, low-carb, high-carb, low-fat, vegan, paleo. Each one has a loud fan club, and most gyms spend their days refereeing the arguments. The research, though, won't pick a side. Across landmark randomized trials, reviews covering around ten million people, and traditional eating patterns from five continents, the thing that separates healthy diets from unhealthy ones isn't the name on the plan. It's three things: the quality of the food, whether the nutrients actually arrive, and whether a person can keep going. I've watched that play out with every client I've trained, and I've watched the diet wars ignore it just as consistently.

By Barry, personal trainer, written with the SafeTable research desk 19 min read

25

diet evidence guides

every pattern in the SafeTable app

6

landmark sources below

five studies and one population map

5

fundamentals that decide

the same in every food culture

1

sentence of relief

you do not have to be perfect

The short answer

Almost any sensible diet can be healthy.

  • Low-carb and low-fat tie. Trials that built a good low-carb diet and a good low-fat diet found the same weight loss at one year.
  • The middle wins. One of the largest cohorts ever assembled found the safest carbohydrate window in the moderate middle, not at an extreme.
  • Processing decides. In one of the most tightly controlled feeding studies ever run, people gained weight on a calorie-matched ultra-processed diet and lost weight on whole food.
  • Real food, every time. Every long-lived population studied so far, at every macro ratio, ate real food, moved a lot and stayed at it for a lifetime.

That is the thesis of this hub. Each of the 25 diet guides below applies it honestly, including where the science is thin and where an honest writer has to say no.

The view from the gym floor

I have one quiet advantage over most people who publish diet opinions: I keep score after they stop talking. Personal training is where nutrition arguments meet real life. A new client turns up carrying whatever diet they were most recently convinced by: a keto notebook, a screenshot of a fasting window, a shelf of branded shakes. A few weeks later, we both find out what that diet is actually made of, and whether a real person can live inside it.

Early on, I made the classic mistake. I had one plan and tried to fit every client into it. Some agreed and did well. Others kept their own eating (vegan, keto, plain "normal food") and did just as well, as long as the plan ran on real food and they actually liked living in it. No diet name ever predicted who would thrive. The fit between the plan and the person did, and so did the quality of how the plan was built.

That taught me to ask a better question. Not "which diet is best?" but "what does this diet share with every other one that worked?" So I sat down with the research, expecting it to name a winner. It didn't. Five landmark studies and one population map, all covered below, point the same way: the name of the plan is close to irrelevant. The construction is everything.

What follows is that evidence, the shared foundation every healthy diet stands on, an evidence grade for every pattern SafeTable supports, and the questions I now run every client through before they commit to a plan.

A bright training studio with a kettlebell, a resistance band and a glass meal-prep container of chicken, greens and sweet potato on the wooden floor.
Illustration: a training studio, with a home-prepared meal on the floor beside the kettlebell.

What the evidence actually shows

I went looking for a winner: the one study that would crown the right diet and end the argument. Five landmark studies and one population map later, I had finished with the argument instead. Not one of them cares about macro ratios the way the internet does. Together they explain why the diet wars never resolve, and why the people quietly getting results are not the ones arguing.

Each card below lists the study design, who was studied, how long it ran and what it found. The bold figures are the ones worth remembering.

Landmark study

DIETFITS: a healthy low-carb diet vs a healthy low-fat diet (JAMA, 2018)

Randomized controlled trial 609 adults 12 months

Weight loss came out nearly identical, at about 5–6 kg in both groups. Each person's baseline insulin sensitivity did not predict which diet worked better for them. Both diets were built from whole food, and both cut sugar and refined flour.

Read the study

Landmark study

Hall et al.: the NIH inpatient ultra-processed diet trial (Cell Metabolism, 2019)

Randomized crossover, metabolic ward 20 adults 2 weeks per arm

Calories, macros, sugar, fibre and sodium were all matched, so the two diets had nearly identical nutrition labels. Yet people ate 508 kcal a day more on the ultra-processed version and gained weight, while they lost weight on the whole-food version. Processing level, not the macro maths, overrode satiety.

Read the study

Landmark study

PURE: 135,000 people across 18 countries (The Lancet, 2017)

Prospective cohort 135,335 adults, 5 continents Median 7.4 years

Carbohydrate above 60% of energy, mostly from refined staples, tracked with higher total mortality. Total fat, including saturated fat, tracked with lower mortality. Neither is a hero or a villain. The extremes and the refining are the problem.

Read the study

Landmark study

Seidelmann et al.: the carbohydrate U-curve (Lancet Public Health, 2018)

Cohort plus meta-analysis 432,179 adults ~25 years

Mortality was lowest at 50–55% carbohydrate and rose at both extremes. What replaced the carbohydrate decided the direction. Swapping carb calories for plant fat and plant protein tracked with reduced mortality. Swapping them for animal fat and animal protein tracked with increased mortality.

Read the study

Landmark study

Ma et al.: umbrella review of 124 meta-analyses (Nutrients, 2024)

Umbrella review Over 5 million pooled Varies by included study

It pooled the major cohort reviews. Both very-low-carb and very-low-fat patterns sat alongside worse outcomes. Balanced macronutrient intake, within a wide range, sat with the best outcomes. Dose-response relationships are U-shaped for both carbohydrate and fat.

Read the study

Food quality beats the label

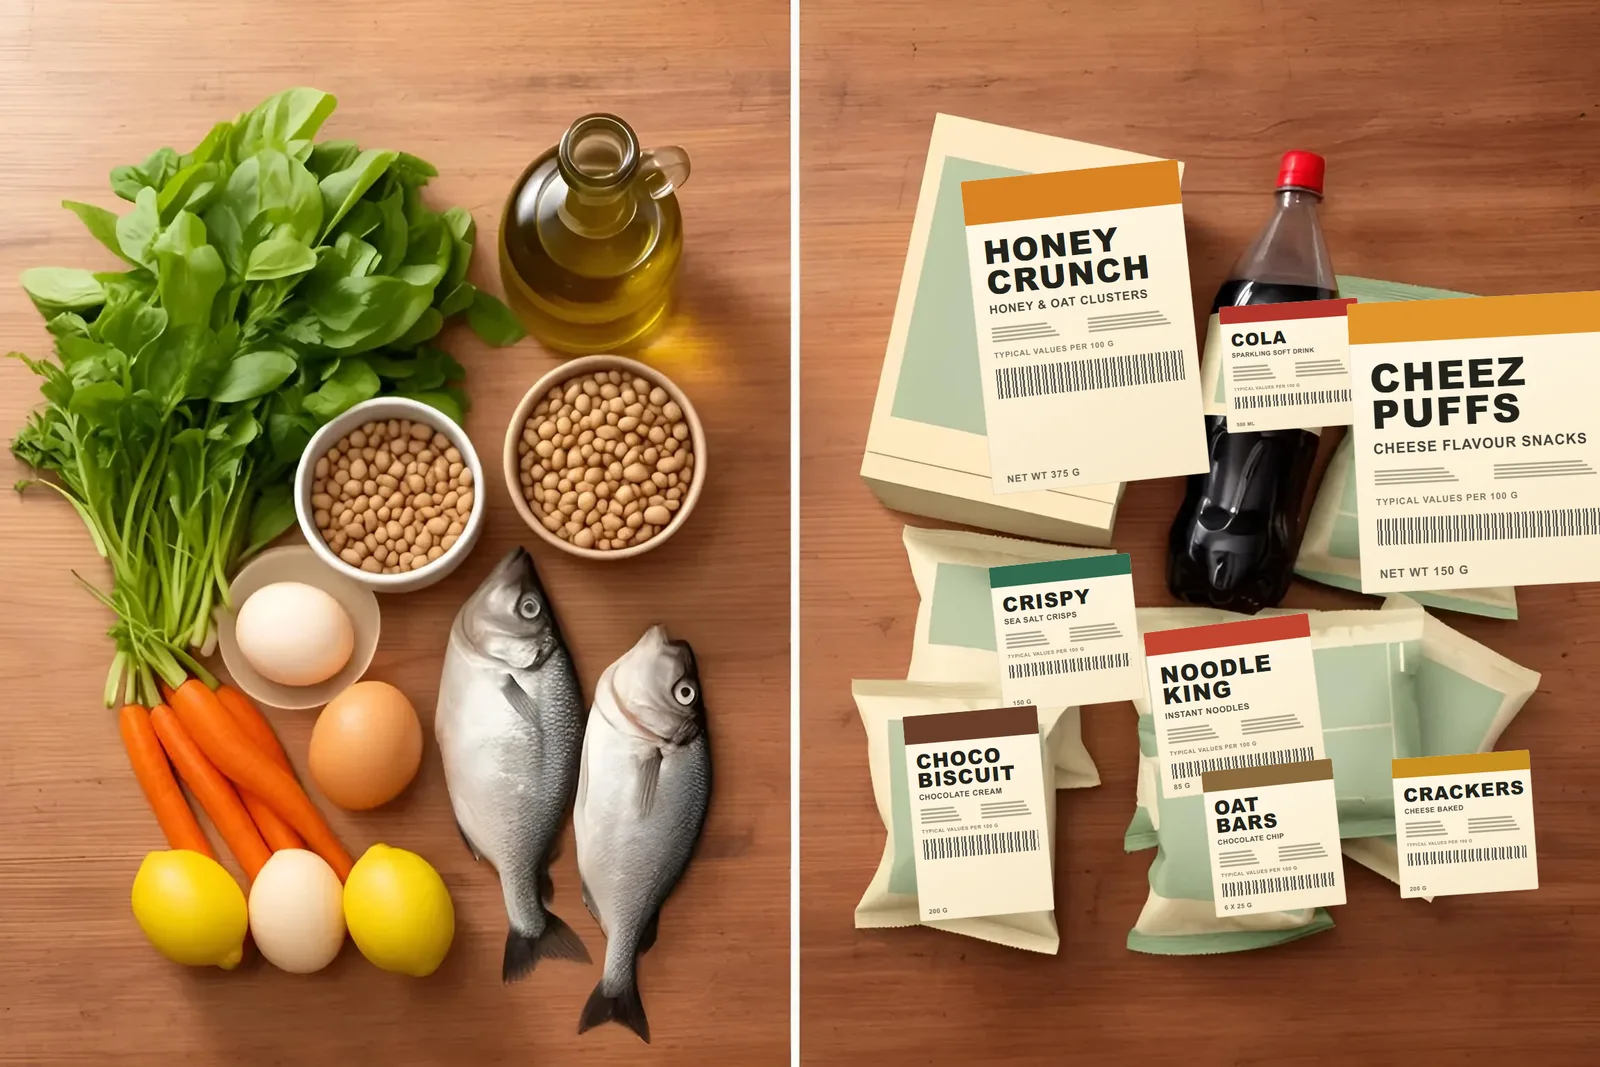
Two people can follow the same named diet and, a year later, be in two very different places. A big part of that gap comes down to how processed the food is. Nutrition researchers use a classification called NOVA, which sorts food by how much it has been processed, not by its nutrients.

Overhead view of whole foods on the left (leafy greens, eggs, carrots, beans, fish, lemons, olive oil) and labelled packaged snacks and a soft drink on the right.
Illustration: whole foods on the left, labelled ultra-processed packs on the right. Both sides are food. Only one comes with an ingredient list you need to decode.
  1. 1

    Unprocessed or minimally processed

    Edible things from plants and animals: vegetables, beans, eggs, meat, milk.

  2. 2

    Culinary ingredients

    Cooking ingredients: oil, salt, sugar.

  3. 3

    Processed foods

    Simple combinations like bread, cheese and canned fish.

  4. 4

    Ultra-processed

    Industrial formulations built from extracted substances and additives: soft drinks, snack packs, instant noodles, most breakfast cereals and, yes, a large slice of the "health food" aisle.

Figure 1. The four NOVA groups, ordered from least to most processed. Group 4 is the one the research keeps flagging.

The research gives three reasons why processing matters so much.

1

The calorie experiment

Hall's metabolic-ward trial put matched macros on two shelves. Whole food produced spontaneous under-eating of about 500 calories a day. The ultra-processed shelf produced over-eating, which happened before fullness registered.

2

45 meta-analyses, one pattern

The 2024 BMJ umbrella review found dose-response links between ultra-processed food intake and cardiovascular disease, type 2 diabetes, obesity, several cancers, depression and mortality, across about 10 million people.

3

The food matrix

Two foods with identical nutrition labels can digest differently. Intact cell structure slows how fast you eat, feeds gut bacteria and triggers satiety hormones. Pulverized industrial food skips all three.

Figure 2. Three reasons the same nutrition label can lead to different results.

This is why the diet wars are mostly noise. Almost every named diet (keto, paleo, vegan, Mediterranean, DASH, Whole30) quietly agrees on one instruction: stop eating most ultra-processed food. From an evidence standpoint, that shared agreement does more of the work than the differences between the diets.

Long-lived populations don't share a macro ratio

If one macro ratio unlocked long life, you would expect to see it in a long-lived population eating that ratio. Instead, the pattern shows up at every ratio, always on the same foundation. Table 1 shows five examples. Read each row as a whole way of eating, not as a macro target.

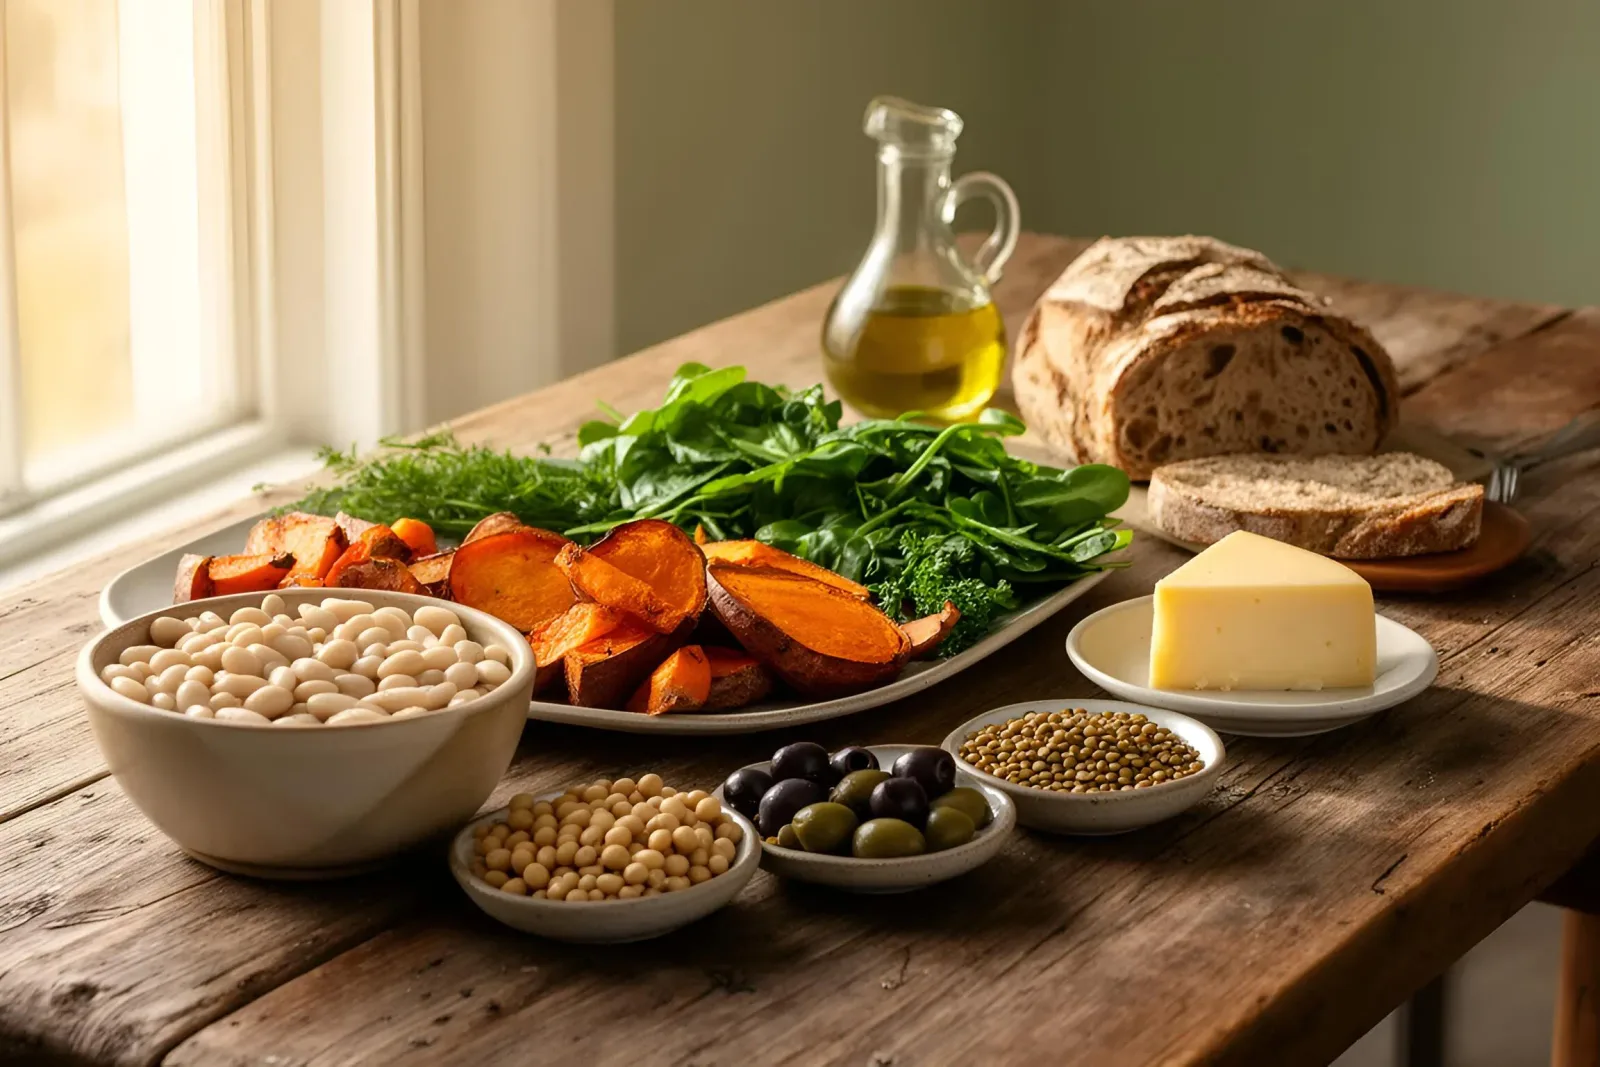
A rustic wooden table with bowls of white beans, roasted sweet potatoes, leafy greens, bread, olives, lentils, soybeans, a jug of olive oil and a wedge of cheese.
Illustration: the simple building blocks that appear again and again in the diets in Table 1.
Population Approx. carb / fat / protein What stands out
Okinawa, Japan ~85 / ~6 / ~9sweet potato, soy, vegetables Very-high-carb, extremely low-fat, very-low-protein. Longevity record: among the world's best.
Ikaria, Greece ~45 / ~40 / ~15olive oil, greens, legumes, goat Higher-fat Mediterranean pattern. More than twice the expected rate of reaching 90.
Sardinia, Italy ~50 / ~30 / ~15barley bread, beans, pecorino, wine Includes daily saturated fat and alcohol. Highest documented male centenarian rate on earth.
Nicoya, Costa Rica ~60 / ~20 / ~18beans, corn, squash, eggs, pork A moderate middle: home cooking, low processing, about 20% lower mortality than the rest of the country.
Loma Linda, USA ~55 / ~30 / ~15plant-forward, nuts, legumes, whole grains The Adventist cohort: 7–10 years of extra life expectancy, in America.
Table 1. Approximate macronutrient split (% of energy from carbohydrate, fat and protein) in five long-lived populations, with the foods each is known for. Figures are rounded and vary between sources.

Not a single healthy long-lived population ran on ultra-processed food. Not one ran on a diet that offered nothing to the body or to the people eating it. If macro ratios were the key, Okinawa and Ikaria could not share a planet.

What every healthy diet shares

For years I asked the wrong question whenever a client succeeded: "what made their diet the winner?" The better question is what their plan had in common with every other plan that worked. Strip the brand names off the five healthiest diets, or the five longest-lived towns, and the same five fundamentals are running underneath. You can swap between them freely.

Real, whole food

The most consistent finding in all of nutrition. Diets built on recognisable food beat diets built from ingredient lists, at every macro ratio.

Enough protein

Around 0.8 g/kg body weight minimum for most adults — more for older adults, hard training, or a calorie deficit. Every healthy pattern keeps this.

Fibre & micronutrients

Vegetables, fruit, legumes, whole grains, nuts. Vitamins, minerals and fibre come from food structure, not from labels shouting about added ones.

Energy balance

Portions somewhere near what you burn. The ultra-processed trial showed why whole food does this almost by itself: you eat ~500 fewer calories a day.

You can live on it

The best diet is the one you can sustain for years, not months. Adherence — not the macro split — is the strongest predictor of long-term results.

Figure 3. The five fundamentals behind every healthy pattern in this guide. You can build all five into almost any plan.

The diet spectrum

After enough years on the gym floor, I stopped being impressed by which diet people declared and started noticing where it sat. This grid is that observation, drawn out. Pick any cell and you will find evidence-backed eating inside it. The position tells you where a pattern sits on carbohydrate and fat. The colour tells you how much evidence backs it. Colours mark evidence strength, not moral worth. The grade key is explained in How we research, further down.

The healthy-diet map: one axis does not decide your health Every cell in this map contains a pattern ordinary people follow — and the cell tells you almost nothing on its own. Colours show evidence strength.
Evidence grade: A — strong B — moderate C — limited D — insufficient
⏰ Intermittent fasting is a schedule, not a macro position — the food eaten inside the window can be anything above. Asterisked condition patterns (gluten-free, low-sodium, diabetes-friendly, bone-health) adapt the shape of whichever base diet you choose. Placements are approximate typical intakes; individual versions vary.

Figure 4. Where each pattern typically sits. Columns show the share of calories from carbohydrate, and rows show the share from fat. Colour shows the evidence grade. A position describes the macros, not whether a diet is good or bad.

* Condition-based patterns (low FODMAP adjustments aside — gluten-free, low-sodium, diabetes-friendly, bone-health) adapt the base diet rather than pin a macro position; they are placed at their typical real-world home.

Compare all 25 diet guides

Here is every dietary pattern SafeTable supports, with its evidence verdict, its honest strengths and its honest costs. Every card links to a full guide that shows the evidence grade up front, including the patterns whose marketing budgets outran their footnotes. Guides open in the same window, so you can read them in order.

Ancestral & elimination

Built on removing food groups, usually with a whole-food emphasis. For most people, most of the benefit comes from what gets removed — particularly ultra-processed food.

Protein-focused

Built around one number rather than one philosophy — and that makes it one of the most adaptable tools in the set.

Timing patterns

Not a food list at all — a schedule. What you eat still matters; these change when.

How to judge any diet in seven questions

Every plan I have handed a client had to survive these seven questions first. They are also the checklist behind each guide above. It takes about two minutes to run through any plan a book, influencer, GP or app hands you. If a plan survives all seven, it will probably work, whatever it is called.

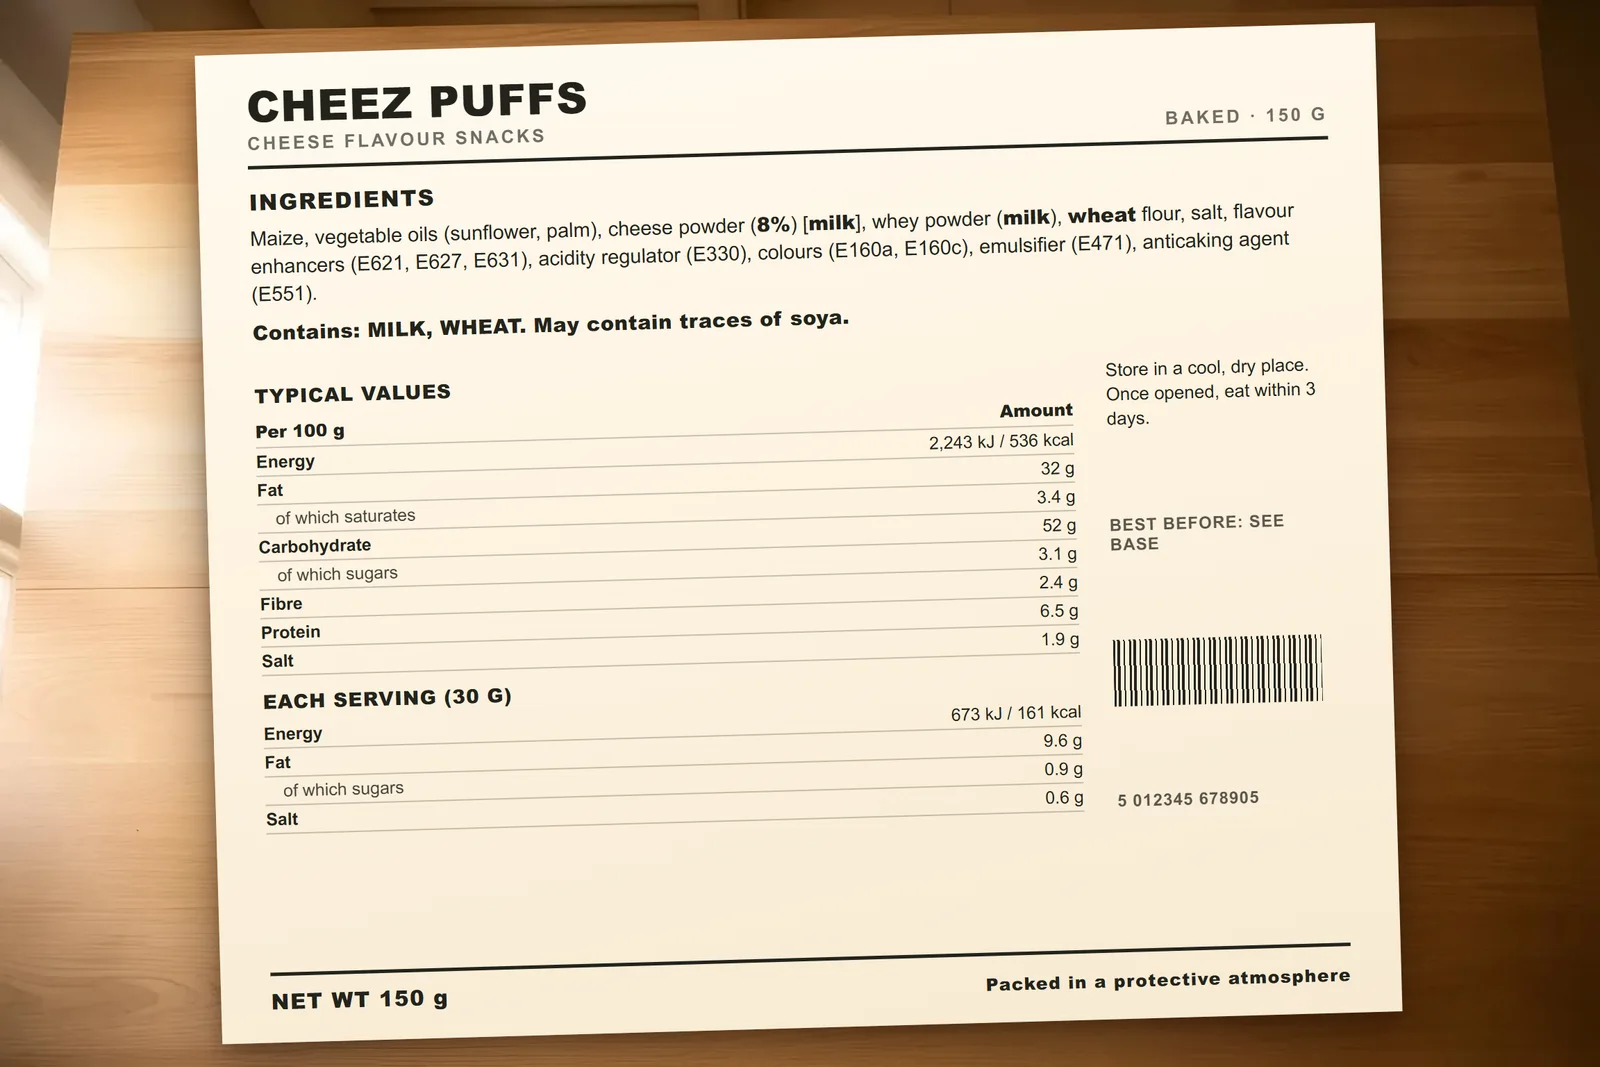
Close-up of a snack packet ingredients label listing maize, vegetable oils, cheese powder, flavour enhancers (E621, E627, E631), colours and emulsifiers, with a nutrition table per 100 g and per 30 g serving.
Illustration: a typical ultra-processed ingredients panel. Maize, oils and cheese powder first, then flavour enhancers (E621, E627, E631), colours and emulsifiers. If the list is longer than the food, treat that as a signal.
  1. 1. Does it run on whole food?

    Look at what you would actually eat each day, not the marketing. If about 80% of it is recognisable food, that is a good start. If it depends on branded bars, shakes or powders, it is a product business wearing a diet costume.

  2. 2. Does it cover protein?

    Around 0.8 g/kg body weight minimum for healthy adults, and more for older adults, hard training or a calorie deficit. Any diet that cannot get you there is a weight plan first and a health plan second.

  3. 3. Does it cover fibre and micronutrients?

    Check where the plants, whole grains, nuts, fruit and legumes sit in the plan. Total elimination of a whole food family needs a reason and usually a supplement.

  4. 4. Is the energy balance survivable?

    Portions should land near what you burn. If the plan requires misery to maintain a deficit, you will regain and blame yourself rather than the plan.

  5. 5. What are you being asked to eliminate, and why?

    Ultra-processed food earns elimination with the most consistent evidence in nutrition. Food families like grains, dairy or plants get no such high ground. Legitimate arguments exist, but the burden of proof is on the eliminator.

  6. 6. What is the evidence grade on the actual claim?

    Not anecdotes. Not testimonials. Randomized trials, cohorts or, better, a meta-analysis. This page explains the grades, and every guide shows its own.

  7. 7. Would you still be doing it in five years?

    The most underused question in nutrition. Over twelve-month horizons nearly every sensible plan converges; over five years, only the sustainable ones have members.

When a diet is not okay

I have also met people who found the edge of "any sensible diet can work" the hard way. Some of them were on plans I would run differently today, back when I had not yet learned where the fence was. So read this section slowly. Some patterns are not sensible as written. Some people should not restrict without a clinician involved. And a few red flags cancel out anything else a website claims, whatever credentials stand behind it.

Red flags in the plan itself

  • Bans an entire food group without a medical reason and expects you to buy their supplement line
  • Claims to work for everyone, always, and dismisses real risks as myths
  • Sells the "one true diet" and treats every alternative as sabotage or corruption
  • Promises more than 2 lbs a week of fat loss, indefinitely, or "cures" a chronic disease
  • Cites no studies, or cites only testimonials, or cannot tell you what its own risks are

The people who should not self-restrict

  • Anyone with type 1 diabetes, kidney disease, heart failure, or a complex medication regimen. Dietary change can change drug doses.
  • Anyone pregnant or breastfeeding. Restriction has a real cost curve.
  • Anyone with a personal or family history of disordered eating. Rigid food rules reliably escalate.
  • Children and teenagers, whose nutritional floors are higher and whose relationships with food are still developing.
  • Older adults under-eating protein. Sarcopenia hides in calorie deficits.

Where does that leave the strictest patterns: carnivore, 80/10/10 and macrobiotic? We cover them anyway, in full, with their evidence grade on the first screen rather than buried nine scrolls down. Read the carnivore guide or the 80/10/10 guide and you will see the "any sensible diet can work" idea does not need to stretch to cover the extreme versions. It simply cannot stretch that far, and this hub says so.

How we research the diet guides

The gym floor taught me what to look for. This pipeline is how every guide earns its verdict, and the outcome grades get published up front rather than buried in the eleventh paragraph.

  1. 1Source the primary literature. Randomized trials, systematic reviews, large prospective cohorts and meta-analyses, with DOIs so you can verify every claim in one click.
  2. 2Grade the evidence A through D, domain by domain, on a standard rubric adapted from GRADE. Not a vibe.
  3. 3Write for the reader, not the exam. Plain sentences, real numbers, and mechanistic jargon translated on first use.
  4. 4Separate food from the label. "Clean" and "dirty" versions are explicitly addressed for every pattern that has them.
  5. 5Publish the risks with the verdict. Every guide carries a "who should not do this" section and a firm not-medical-advice notice.

What the evidence grades mean

A

Strong evidence

Multiple randomized trials or meta-analyses of consistent, meaningful effect; endorsed by major health bodies.

B

Moderate evidence

Randomized trials or large cohorts with generally consistent results; moderate effect sizes.

C

Limited evidence

Small trials, observational data, or inconsistent results. Promising, not proven.

D

Insufficient evidence

Mainly mechanistic reasoning, case reports and testimonials. No randomized trials.

Figure 5. The four evidence grades used across the diet guides, from strongest (A) to weakest (D).

Common questions

Can any diet be healthy?
Any sensible diet can be healthy when it is built from whole foods, meets your protein, fibre and micronutrient needs, and you can sustain it. Randomized trials directly comparing well-constructed low-carb and low-fat diets found near-identical weight loss, and landmark cohorts show the healthiest carbohydrate window sits in the moderate middle. What reliably harms: ultra-processed food, nutrient gaps, and extremes nobody can maintain. Extreme elimination patterns — carnivore, 80/10/10 — have weak evidence and belong in a different category entirely.
What matters more: the diet or the food quality?
Food quality, and it is not close. In one of the most tightly controlled studies on this question, the meals were matched for calories, macros, sugar, fibre and sodium. People still ate about 508 more calories a day on the ultra-processed diet, gained weight on it, and lost weight on the whole-food diet. Processing level beats macro ratio as the health variable.
Which diet has the strongest evidence?
The Mediterranean diet, with multiple large randomized trials including a ~30% reduction in major cardiovascular events in the PREDIMED study, followed by DASH, which deliberately lowered blood pressure in landmark trials. Several others — keto, low FODMAP, plant-based — have grade-A or solid evidence within specific uses. No diet is best at everything, and "strongest evidence" depends what outcome you count.
Why do nutrition studies seem to contradict each other?
Because they measure different things at different strengths. Randomized controlled trials test cause-and-effect for months. Cohort studies follow hundreds of thousands of people for years but only show association. Both are honest; both have blind spots. This hub grades every claim so you can see which kind of evidence sits behind it.
Is a high-carb diet unhealthy?
Whole-food carbohydrate is not. Two of the longest-lived populations in documented history — Okinawa at roughly 85% carbohydrate and Sardinia at roughly 50% — sat at opposite ends of the fat scale and both lived long. What harms is refined, starch-milled, sugar-laden carbohydrate. The 2018 Lancet Public Health analysis found mortality lowest at 50–55% carbohydrate, rising at the extremes.
What should I do if my partner and I follow different diets?
Pick whichever evidence-backed pattern fits your health goal — or keep one flexible base and adapt each plate. SafeTable is built for exactly this: one shared recipe, personalised portions and diet adaptations per plate from the same handful of ingredients.

The SafeTable app

Built for one person or for two, around the diet you actually want.

SafeTable is an adaptive nutrition app. Use it on your own to plan dinners that fit your diet, or cook with a partner: one shared recipe, two plates, each built for its own goals. Either way, it works from the same diet choices this guide walks through.

  • Mediterranean
  • DASH
  • Vegan
  • Keto / Low-Carb
  • Gluten-Free
  • Low-Sodium / Heart
  • Diabetes-Friendly
  • Healthy Eating
  • Every diet in this guide. Pick the pattern that fits your goal, including condition-based options like gluten-free, low-sodium and diabetes-friendly. Each guide on this page is in the app's catalogue.
  • A basic healthy-eating base. Healthy Eating is one of the app's default options: nothing banned, built around whole food, and a good place to start if you don't want a named diet.
  • Solo or shared. Cooking for one? Your diet, your plan, your grocery list. Cooking together? Invite a partner and each plate follows their own diet.
See how it works

Free during beta · No credit card

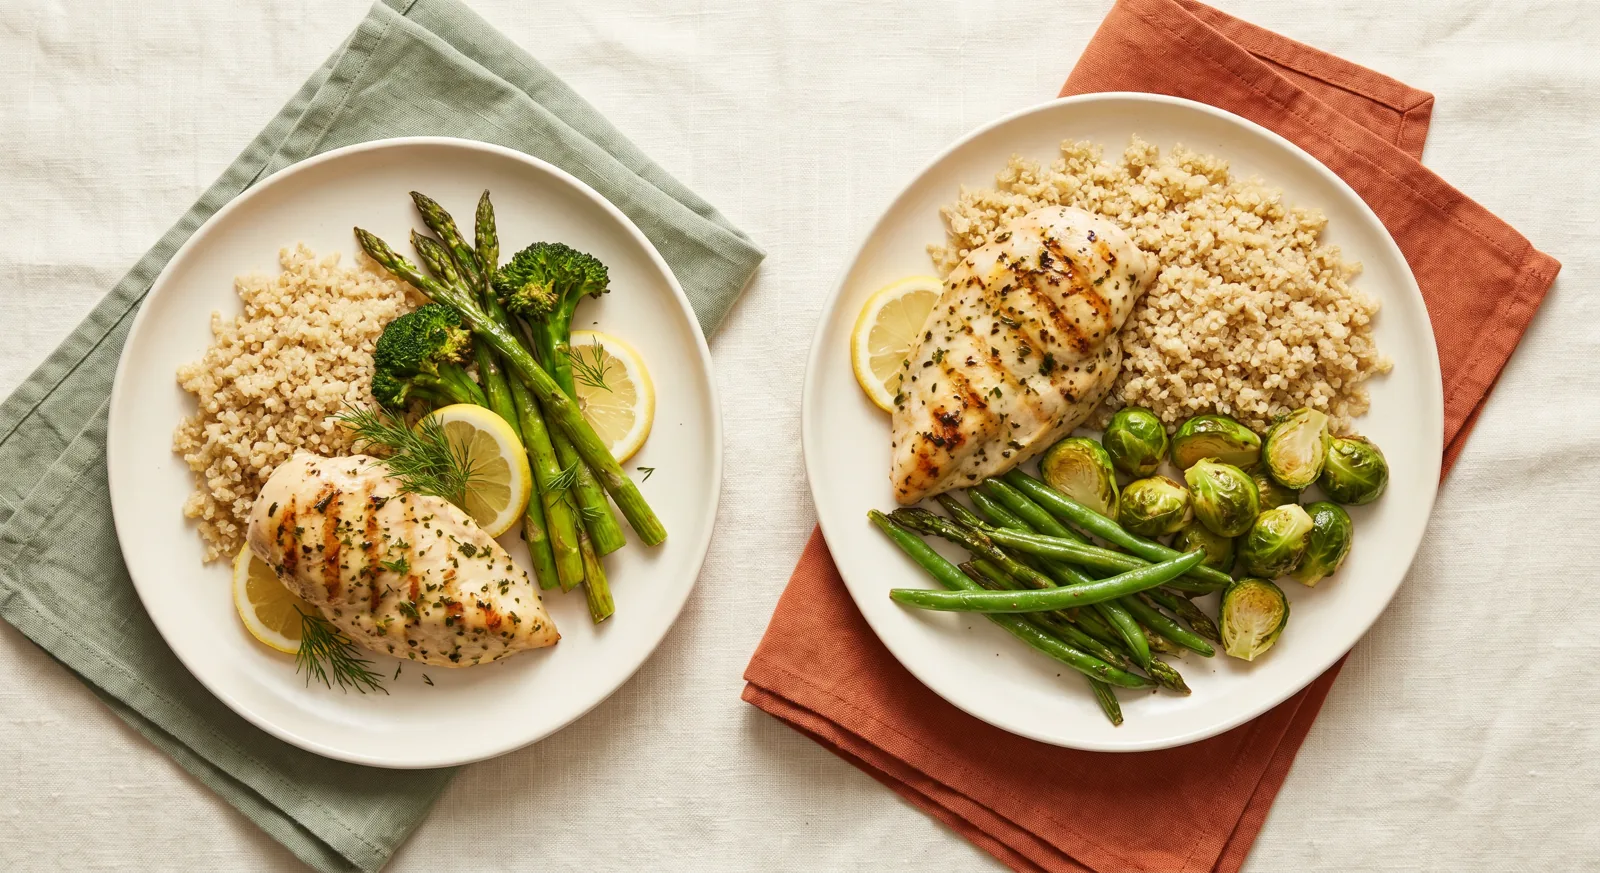
Two plates with the same grilled chicken and grain base: one served with asparagus and broccoli, the other with green beans and Brussels sprouts, set on sage and terracotta napkins.

Sources & further reading

Primary studies, systematic reviews and public-health guidelines used to write this guide.

  1. [1] Gardner CD, et al. Effect of low-fat vs low-carbohydrate diet on 12-month weight loss in overweight adults: the DIETFITS randomized clinical trial. JAMA, 2018.
  2. [2] Hall KD, et al. Ultra-processed diets cause excess calorie intake and weight gain: an inpatient randomized controlled trial of ad libitum food intake. Cell Metabolism, 2019.
  3. [3] Dehghan M, et al. Associations of fats and carbohydrate intake with cardiovascular disease and mortality in 18 countries (PURE): a prospective cohort study. The Lancet, 2017.
  4. [4] Seidelmann SB, et al. Dietary carbohydrate intake and mortality: a prospective cohort study and meta-analysis. Lancet Public Health, 2018.
  5. [5] Ma Y, et al. Dietary macronutrient intake and the risk of cardiovascular disease and mortality: an umbrella review of meta-analyses. Nutrients, 2024.
  6. [6] Lane MM, et al. Ultra-processed food exposure and adverse health outcomes: umbrella review of epidemiological meta-analyses. BMJ, 2024.
  7. [7] Estruch R, et al. Primary prevention of cardiovascular disease with a Mediterranean diet supplemented with extra-virgin olive oil or nuts (PREDIMED). NEJM, 2018.
  8. [8] Monteiro CA, et al. Ultra-processed foods, diet quality, and health using the NOVA classification system. Public Health Nutrition, 2018.
  9. [9] Orlich MJ, et al. Vegetarian dietary patterns and mortality in Adventist Health Study 2. JAMA Internal Medicine, 2013.
  10. [10] Willcox BJ, et al. Caloric restriction, the traditional Okinawan diet, and healthy aging. Annals of the NY Academy of Sciences, 2007.
Barry, personal trainer

About the author

Barry, personal trainer

Barry has spent years as a personal trainer, watching ordinary people run an extraordinary range of diets and quietly checking each one against the research. This hub was written with the SafeTable research desk: the studies are linked, the grades come from a published rubric, and the verdicts are honest on purpose, including the uncomfortable ones. Nobody who reads it is being asked to believe anything without a citation next to it.

Made with ❤️ by BYTEDIGITAL
Digital solutions for businesses.